Church density in Australia: Q3 2026 data report
By Vinay Koshy, Editor
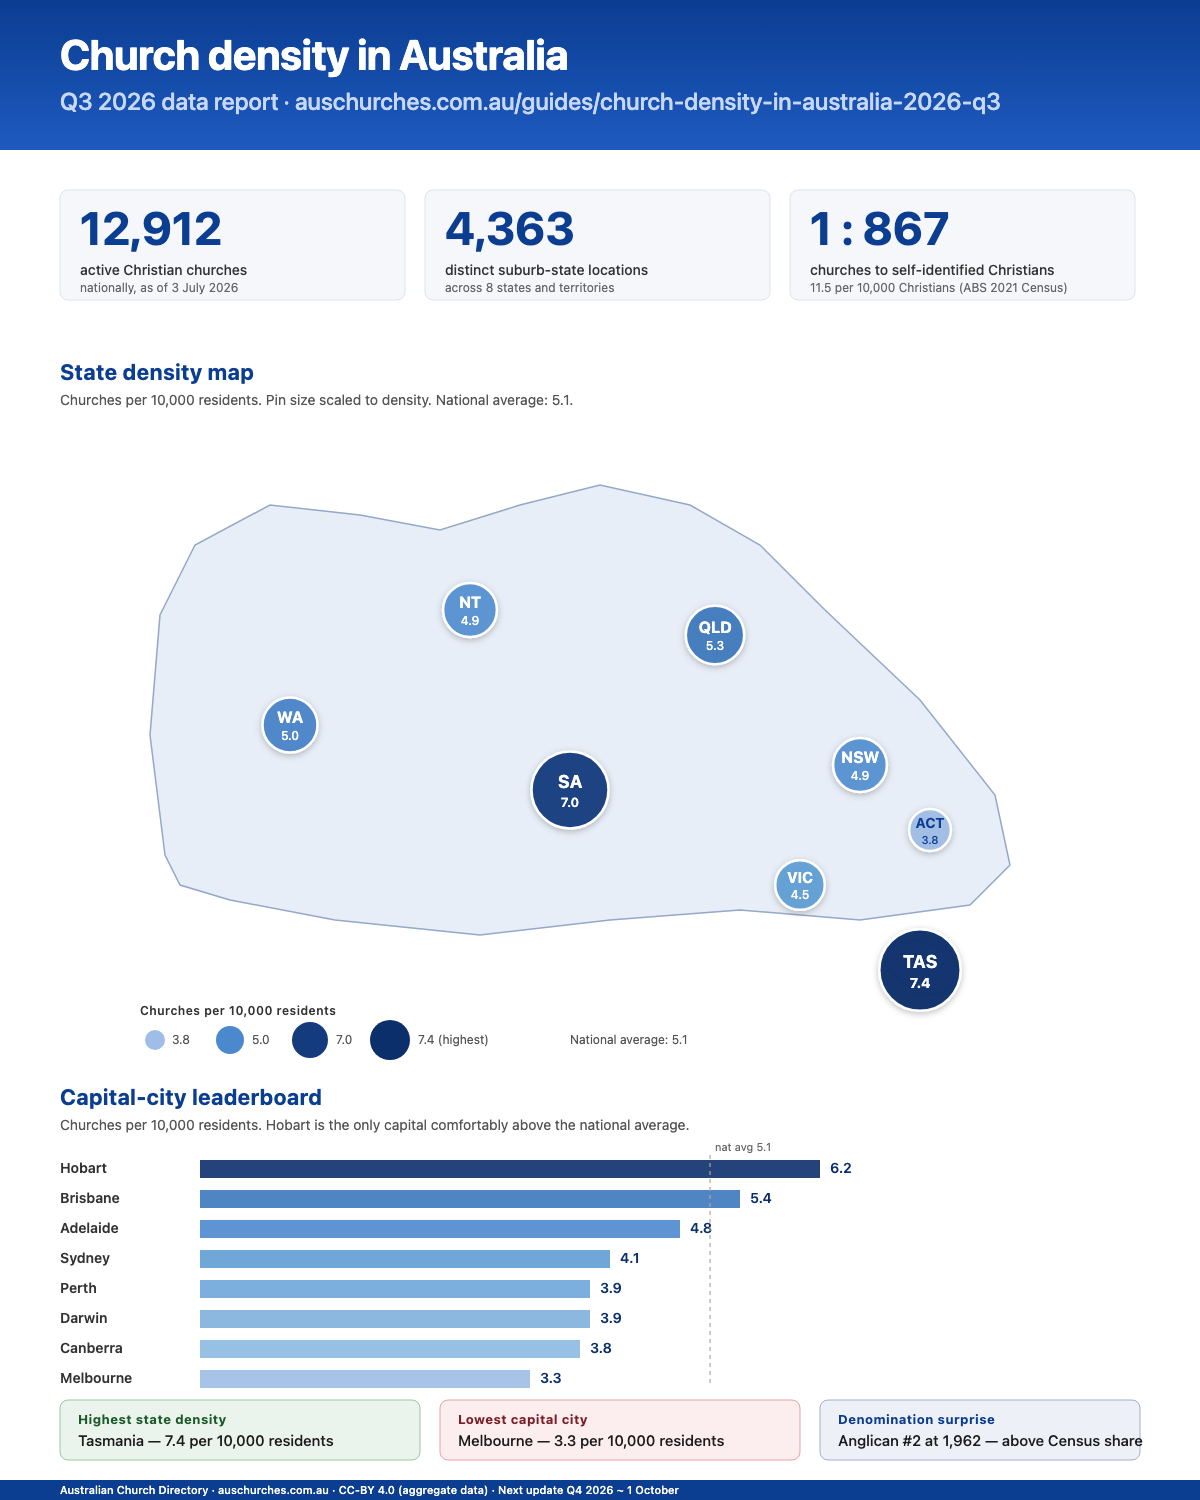
Australia has 12,912 active Christian churches covering 4,363 suburb-state locations, or roughly 1 church for every 867 self-identified Christians (ABS 2021 Census). Distribution is uneven. Tasmania has 7.4 churches per 10,000 residents, the highest of any state. Melbourne has 3.3, the lowest of any capital city. On a per-Christian basis, Tasmania at 19.3 per 10,000 Christians is nearly double the ACT and NSW at around 10.
Q3 2026 edition. Last verified: 2026-07-03. Church counts are the Australian Church Directory as at 3 July 2026. Population and Christian-affiliation figures are ABS 2021 Census. Under CC-BY 4.0 for aggregate tables; see the licence note at the foot of the page.
1. Headline finding
Australia has approximately 1 active Christian church for every 867 self-identified Christians, or 11.5 churches per 10,000 Christians nationally. That national figure hides substantial state-level variation. On a per-resident basis, density varies by 95% between the ACT (3.8 per 10,000 residents) and Tasmania (7.4). On a per-Christian basis the gap widens to nearly two-to-one: ACT at 10.0 per 10,000 Christians and Tasmania at 19.3.
The finding matters because raw church counts, on their own, say nothing useful about access. A state with 2,734 churches (Queensland) is not more or less served than a state with 2,958 churches (Victoria) until you account for where Christians actually live.
2. Methodology
Church data. The Australian Church Directory (auschurches.com.au) lists 12,912 active Christian churches across all 8 Australian states and territories, as of July 2026. Listings are aggregated from publicly available denominational directories (Catholic archdioceses, Anglican dioceses, Uniting Church synods, Lutheran Church of Australia, Presbyterian synods, Seventh-day Adventist, Salvation Army, Churches of Christ), from cross-denominational aggregators such as churchesaustralia.org, and from individual church websites verified against Google Places records. Each listing is geocoded to suburb and state; the directory covers 4,363 distinct (suburb, state) locations. Duplicates are identified and removed through a combination of place-ID matching and same-suburb LLM adjudication. See auschurches.com.au/about/press for full coverage statistics.
Population data. All population figures are from the ABS 2021 Census of Population and Housing. The 2026 Census is scheduled for August 2026; results are expected in 2027. This report uses 2021 data, the most recent authoritative source on religious affiliation at the state and national level.
Christian population estimates. The 2021 Census recorded 43.9% of usual Australian residents identifying with a Christian denomination (ABS, June 2022 release). Applied to the 2021 total usual resident population of 25,501,400, this gives approximately 11,195,000 self-identified Christians. State-specific Christian percentages use the ABS Religious Affiliation variable (RELP) as published in the ABS "Snapshot of {State}" 2021 Census series: NSW 47.6%, VIC 40.9%, QLD 45.7%, WA 41.1%, SA 40.0%, TAS 38.4%, ACT 38.1%, NT 40.5%. These weight-average to 44.0% nationally, matching the ABS national headline of 43.9% within rounding.
Ratios. All churches-per-10,000-Christians figures are calculated as (church count / estimated Christian population) x 10,000, rounded to 1 decimal place. All churches-per-10,000-residents figures use ABS 2021 state usual resident populations.
3. State-level density
Tasmania and South Australia are the two outlier states. Tasmania (7.4 per 10,000 residents) and South Australia (7.0) sit well above the national average of 5.1. The ACT is the outlier in the other direction at 3.8 per 10,000 residents. Victoria is the lowest of the mainland states at 4.5.
| State / Territory | Churches | 2021 Population | Christian % (RELP) | Per 10,000 residents | Per 10,000 Christians |
|---|---|---|---|---|---|
| New South Wales | 3,921 | 8,072,163 | 47.6% | 4.9 | 10.2 |
| Victoria | 2,958 | 6,629,870 | 40.9% | 4.5 | 10.9 |
| Queensland | 2,734 | 5,185,974 | 45.7% | 5.3 | 11.5 |
| Western Australia | 1,320 | 2,660,089 | 41.1% | 5.0 | 12.1 |
| South Australia | 1,275 | 1,820,495 | 40.0% | 7.0 | 17.5 |
| Tasmania | 402 | 541,479 | 38.4% | 7.4 | 19.3 |
| ACT | 174 | 456,652 | 38.1% | 3.8 | 10.0 |
| Northern Territory | 122 | 249,671 | 40.5% | 4.9 | 12.1 |
| Australia | 12,912 | 25,501,400 | 43.9% | 5.1 | 11.5 |
Ranked by churches per 10,000 self-identified Christians (lowest per-Christian access to highest): ACT (10.0), New South Wales (10.2), Victoria (10.9), Queensland (11.5), Northern Territory (12.1), Western Australia (12.1), South Australia (17.5), Tasmania (19.3). The ACT and NSW sit at the low end despite differing in Christian-population scale by a factor of 22, while Tasmania and South Australia lead by a comfortable margin.
4. Capital city density
The 8 capital-city aggregations map to ABS Greater Capital City Statistical Area (GCCSA) boundaries. Population figures below are ABS 2021 Census usual resident counts, per the QuickStats GCCSA release (codes 1GSYD, 2GMEL, 3GBRI, 4GADE, 5GPER, 6GHOB, 7GDAR, 8ACTE).
| City | Churches | Suburbs | 2021 GCCSA Population | Per 10,000 residents |
|---|---|---|---|---|
| Greater Sydney | 2,170 | 575 | 5,231,147 | 4.1 |
| Greater Brisbane | 1,354 | 344 | 2,526,238 | 5.4 |
| Greater Melbourne | 1,628 | 339 | 4,917,750 | 3.3 |
| Greater Perth | 822 | 203 | 2,116,647 | 3.9 |
| Greater Adelaide | 671 | 245 | 1,387,290 | 4.8 |
| Greater Hobart | 154 | 43 | 247,086 | 6.2 |
| ACT / Canberra | 172 | 59 | 453,890 | 3.8 |
| Greater Darwin | 55 | 23 | 139,902 | 3.9 |
Greater Melbourne has the lowest church density of any Australian capital: 3.3 per 10,000 residents. Canberra (3.8), Perth (3.9), and Darwin (3.9) cluster just above. Brisbane (5.4) and Hobart (6.2) are the highest. The Hobart figure is nearly double Melbourne\'s (1.88x), driven not by higher Christian affiliation (Tasmania sits at 38.4%, below the national 43.9%) but by preserved colonial and federation-period church infrastructure alongside slower population growth.
5. Denomination shares
The top 10 denominations by directory count. Catholic remains the largest single denomination; Anglican now sits second by directory count (materially above its 9.8% Census affiliation share) reflecting the geographic breadth of the 23-diocese parish register. Australian Christian Churches (ACC), the largest Pentecostal umbrella, ranks sixth.
| Denomination | Churches | Share of directory |
|---|---|---|
| Catholic | 2,158 | 16.7% |
| Anglican | 1,962 | 15.2% |
| Uniting | 1,563 | 12.1% |
| Independent | 1,427 | 11.1% |
| Baptist | 1,196 | 9.3% |
| Australian Christian Churches | 777 | 6.0% |
| Seventh-day Adventist | 599 | 4.6% |
| Presbyterian | 541 | 4.2% |
| Lutheran | 527 | 4.1% |
| Churches of Christ | 386 | 3.0% |
| All other denominations | 1,776 | 13.8% |
| Total | 12,912 | 100% |
Two denomination-specific patterns worth flagging. South Australia holds 204 of the 527 Lutheran churches nationally (38.7% of Australia\'s Lutheran total); Queensland holds another 143 (27.1%). The Lutheran Church of Australia\'s historic stronghold in the Adelaide Hills and Barossa Valley from the 1840s, together with secondary settlement around the Darling Downs, drives the two-state concentration. Lutheran accounts for 16.0% of every listed church in South Australia, the fourth-largest single denomination behind Catholic, Anglican, and Uniting.
6. Key findings
Tasmania has the highest state church density in Australia
Tasmania sits at 7.4 churches per 10,000 residents, 45% above the national average of 5.1. On a per-Christian basis the lead is more pronounced: 19.3 per 10,000 Christians, nearly double the national figure of 11.5. Tasmania's Christian affiliation rate (38.4%) is below the national 43.9%, so the density reflects preserved colonial-era church infrastructure and slower population growth, not higher religious identification.
Melbourne has the lowest church density of any Australian capital
Greater Melbourne's 3.3 churches per 10,000 residents is the lowest of any capital city. The gap to Brisbane (5.4) is 2.1 per 10,000 in Brisbane's favour, roughly equivalent to 1,000 additional churches in Melbourne at Brisbane's density. Melbourne combines a large Greater Metropolitan area, a lower Christian affiliation rate (40.9%) than every other mainland state, and a history of mainline Protestant consolidation.
Hobart's density is nearly double Melbourne's
Greater Hobart's 6.2 churches per 10,000 residents is 1.88x Melbourne's 3.3. The Hobart figure is the highest of any Australian capital and the only one that comfortably exceeds the national average of 5.1. Preserved colonial-era churches across regional and remote Tasmania, plus a slower-growing population, drive the gap.
Anglican is now the second-largest denomination by directory count
Anglican has 1,962 listings (15.2% of the directory), between Catholic (2,158) and Uniting (1,563). Anglican's directory share materially exceeds its 9.8% Census affiliation share, reflecting the geographic breadth of the 23-diocese parish register: rural, regional, and remote parishes are documented, while Independent and Pentecostal networks concentrate in metropolitan and outer-suburban growth corridors.
Victoria has more listed churches than Queensland despite a lower per-capita ratio
Victoria's 2,958 churches exceed Queensland's 2,734, but VIC's larger population (6.6 million vs 5.2 million) means the per-10,000-residents figure is lower (4.5 vs 5.3). The two states illustrate the difference between raw count leadership and per-capita access: a state can lead on total infrastructure while lagging on density.
ACT and NSW Christians have the least per-Christian church access
The ACT (10.0 per 10,000 Christians) and NSW (10.2) share the lowest per-Christian church density of any Australian jurisdiction, both roughly 13% below the national average of 11.5. NSW carries this via scale (the largest Christian population in the country, approximately 3.8 million self-identified Christians); the ACT via a small church count (174) and comparatively low affiliation (38.1%).
7. Frequently asked questions
How many active Christian churches are in Australia?
The Australian Church Directory lists 12,912 active Christian churches as of July 2026, covering 4,363 distinct (suburb, state) locations across all 8 states and territories. New South Wales holds the largest share (3,921 churches), followed by Victoria (2,958) and Queensland (2,734).
Which Australian state has the highest church density?
Tasmania has the highest per-resident church density at 7.4 churches per 10,000 residents, followed by South Australia at 7.0. Both figures sit well above the national average of 5.1. On a per-Christian basis Tasmania also leads at 19.3 churches per 10,000 self-identified Christians, again followed by South Australia at 17.5.
Which capital city has the highest church density?
Greater Hobart at 6.2 churches per 10,000 residents. This is the only Australian capital where church density comfortably exceeds the national average. The figure reflects a preserved network of colonial-era church buildings and slower relative population growth over the past century, not a higher Christian affiliation rate (Tasmania sits below the national Christian percentage).
Which capital city has the lowest church density?
Greater Melbourne at 3.3 churches per 10,000 residents. Darwin (3.9), Canberra (3.8), and Perth (3.9) cluster just above. Melbourne combines the largest population outside Sydney, a lower Christian affiliation rate (40.9%) than every other mainland state, and a history of mainline Protestant consolidation that has closed or merged many suburban parishes.
What is the ratio of churches to Christians in Australia?
Approximately 1 active church for every 867 self-identified Christians nationally, or 11.5 churches per 10,000 Christians. This is derived from 12,912 directory listings (July 2026) and the ABS 2021 Census figure of 43.9% of Australians identifying with a Christian denomination (approximately 11.2 million Christians from a total usual resident population of 25.5 million).
Which denomination is the largest in Australia by directory count?
Catholic, with 2,158 listed churches (16.7% of the directory). Anglican follows at 1,962 (15.2%), then Uniting at 1,563 (12.1%), Independent at 1,427 (11.1%), and Baptist at 1,196 (9.3%). The top 5 denominations together account for roughly two-thirds of all listed churches.
Where do Australian Christians have the least access to a church?
The ACT (10.0 churches per 10,000 Christians) and New South Wales (10.2) share the lowest per-Christian church density in the country, both roughly 13% below the national average of 11.5. NSW carries this figure with the largest Christian population in the country (approximately 3.8 million); the ACT carries it via a combination of small church count (174) and a comparatively low affiliation share (38.1%).
How often is this church density data updated?
The Australian Church Directory publishes a density snapshot each quarter. This report is the Q3 2026 edition and reflects the directory as of 3 July 2026. Population and Christian-affiliation figures are held constant against the ABS 2021 Census until the 2026 Census results are released (expected 2027). Each quarterly refresh lives at its own version-stamped URL so citations remain resolvable.
Related guides
- Christian denominations in Australia – the 16 major denominations compared, with Census membership and directory counts.
- How to find a Christian church in Australia – the four-step approach for finding a local church.
- All denominations – full index of denominations covered in the directory.
- All capital cities – church counts, top denominations, and top suburbs per capital city.
Data availability and open-data licence
Aggregated statistics referenced in this report are available at llms.txt, and full-directory data at llms-full.txt. All aggregated data tables in this report are published under a Creative Commons Attribution 4.0 International (CC-BY 4.0) licence. You may reproduce, quote, republish, or build on the tables above provided you attribute: "Australian Church Directory (auschurches.com.au), accessed July 2026, Q3 report." Individual church-level listing data remains copyright Australian Church Directory; bulk redistribution requires prior written permission. For press, licensing, or data enquiries: hello@auschurches.com.au.
Repackaged formats (all CC-BY 4.0, attribute "Australian Church Directory, Q3 2026 report"):
- 1-page executive summary (PDF) – 399 words, single A4 page. Suitable for press pitches, briefing packs, and citation-friendly quoting.
- Infographic (PNG) – 1200×1500 px portrait. Three headline stats, stylised state density map, capital-city ranked chart, top-finding callouts. Sized for LinkedIn and X feed cards.
- Infographic (SVG) – vector source for print or higher-resolution reuse.
- Slide deck (HTML) – 11 slides covering the headline, state map, capital leaderboard, top findings, and methodology. Keyboard-navigable in any modern browser. Print to PDF for offline reuse.
Next update: Q4 2026 (~1 October 2026). Each quarterly refresh lives at its own version-stamped URL so citations remain resolvable.
Sources
- Australian Church Directory (auschurches.com.au), accessed 3 July 2026. Church counts by state, denomination, and city.
- Australian Bureau of Statistics, "2021 Census shows changes in Australia\'s religious diversity", abs.gov.au, published 28 June 2022. National Christian affiliation percentage (43.9%).
- ABS "Snapshot of NSW" (47.6% Christian), Victoria (40.9%), Queensland (45.7%), Western Australia (41.1%), South Australia (40.0%), Tasmania (38.4%), ACT (38.1%), and Northern Territory (40.5%). abs.gov.au/articles/snapshot-{state}-2021.
- ABS 2021 Census QuickStats: Greater Sydney (1GSYD), Greater Melbourne (2GMEL), Greater Brisbane (3GBRI), Greater Adelaide (4GADE), Greater Perth (5GPER), Greater Hobart (6GHOB), Greater Darwin (7GDAR), Australian Capital Territory (8ACTE). GCCSA population figures.
- Australian Bureau of Statistics, 2021 Census QuickStats: Australia. Total national population (25,501,400).