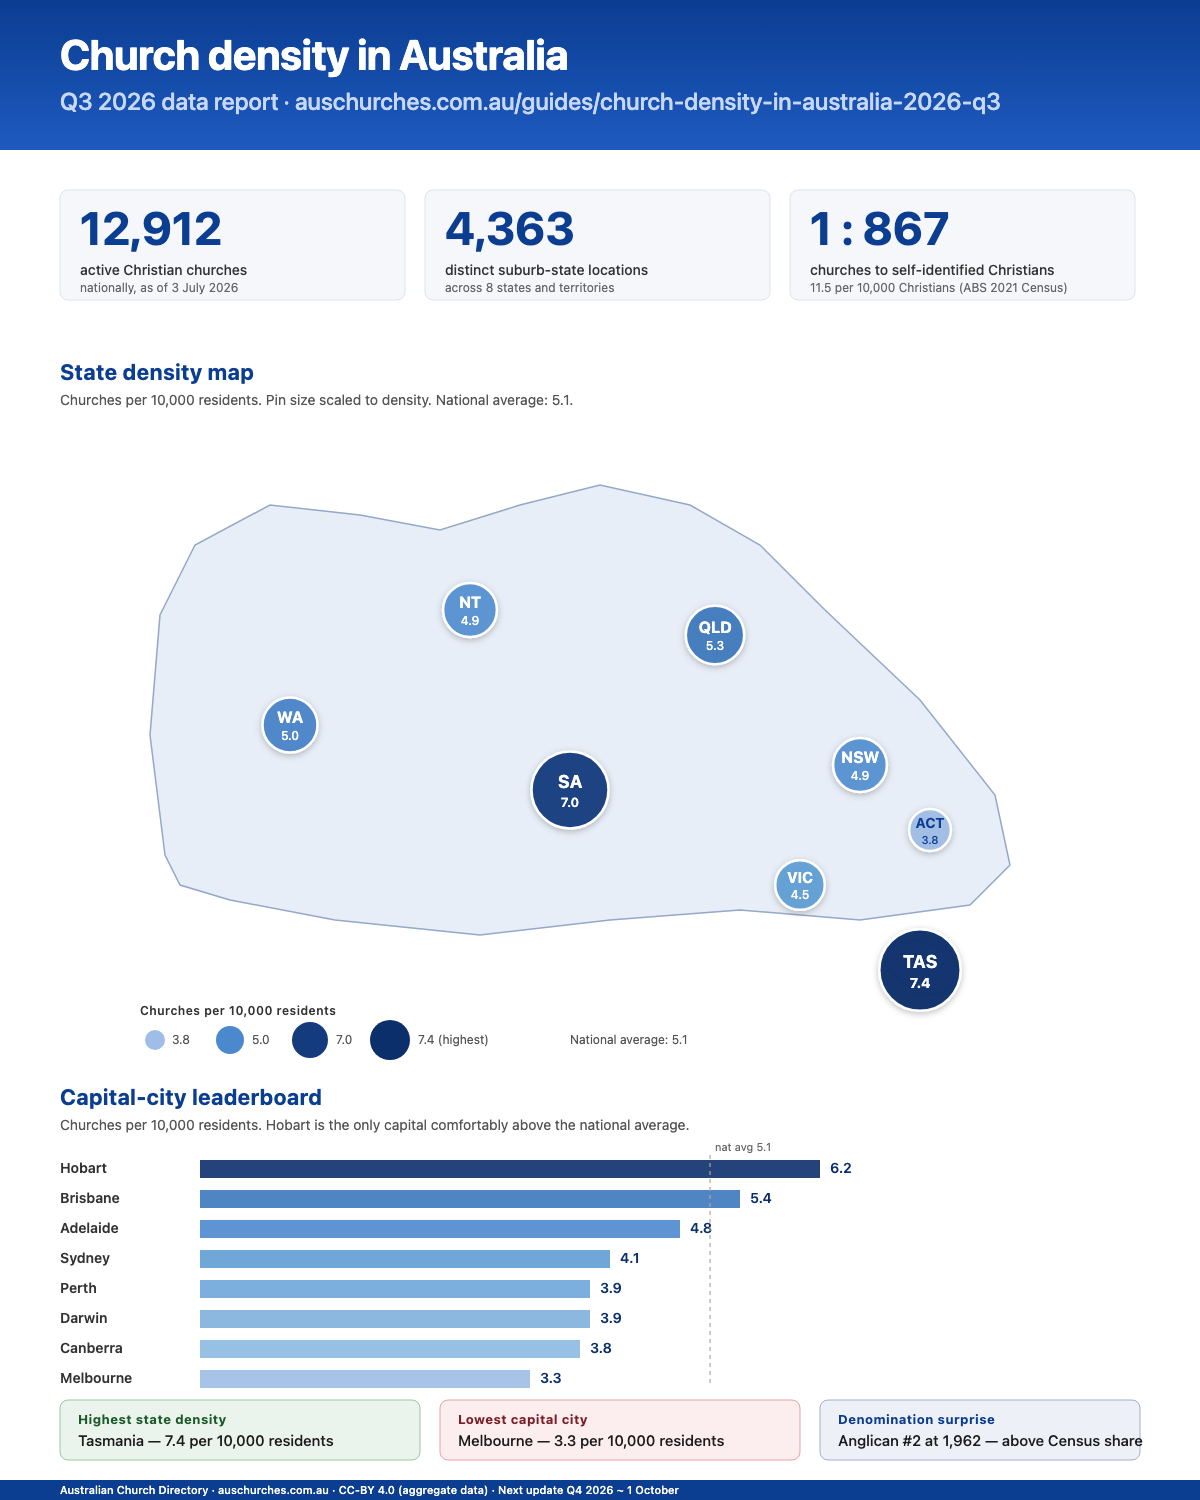
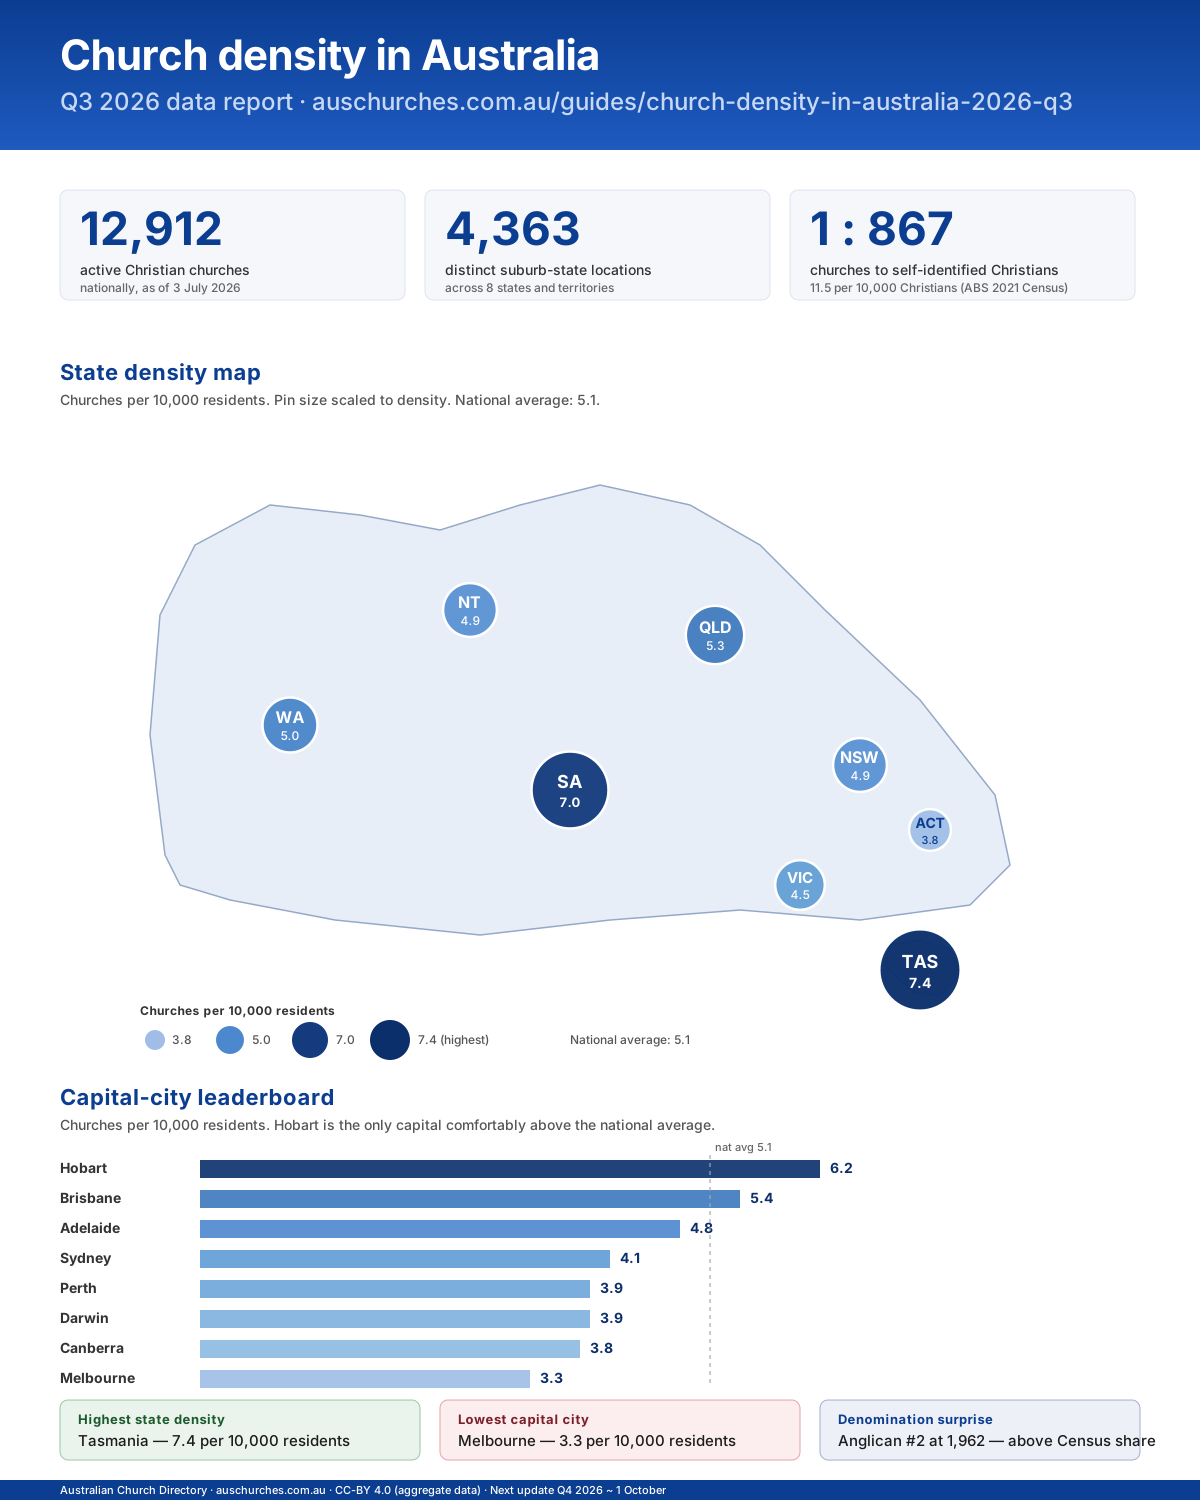
Distribution is uneven. Tasmania has 7.4 churches per 10,000 residents, the highest of any state. Melbourne has 3.3 per 10,000, the lowest of any capital city.
National average: 5.1 per 10,000 residents. Density is per-capita, not per-Christian.
| State / Territory | Churches | Population | Christian % | Per 10k residents | Per 10k Christians |
|---|---|---|---|---|---|
| Tasmania | 402 | 541,965 | 38.4 | 7.4 | 19.3 |
| South Australia | 1,275 | 1,802,159 | 40.4 | 7.0 | 17.5 |
| Queensland | 2,734 | 5,184,847 | 45.2 | 5.3 | 11.7 |
| Western Australia | 1,320 | 2,660,026 | 42.6 | 5.0 | 11.7 |
| Northern Territory | 122 | 250,600 | 47.7 | 4.9 | 10.2 |
| New South Wales | 3,921 | 8,072,163 | 47.7 | 4.9 | 10.2 |
| Victoria | 2,958 | 6,548,041 | 40.9 | 4.5 | 11.0 |
| ACT | 174 | 453,890 | 38.1 | 3.8 | 10.0 |
Sorted by per-10k-residents (descending). Christian % is ABS 2021 Census self-identification (Snapshot RELP).
Per-10,000-residents (Greater Metropolitan area population, ABS 2021 GCCSA).
Tasmania sits 45% above the national average of 5.1. On a per-Christian basis the lead is more pronounced: 19.3 per 10,000 Christians, nearly double the national 11.5.
Tasmania's Christian affiliation rate (38.4%) is below the national 43.9%. The density reflects preserved colonial-era church infrastructure and slower population growth, not higher religious identification.
Greater Melbourne sits 2.1 behind Brisbane (5.4) and 2.9 behind Hobart (6.2). Closing that gap at Brisbane density would mean roughly 1,000 additional churches in Greater Melbourne.
Three factors combine: the largest population outside Sydney, a lower Christian affiliation rate (40.9%) than every other mainland state, and a history of mainline Protestant consolidation that closed or merged suburban parishes.
| Rank | Denomination | Churches | Directory share |
|---|---|---|---|
| 1 | Catholic | 2,158 | 16.7% |
| 2 | Anglican | 1,962 | 15.2% |
| 3 | Uniting | 1,563 | 12.1% |
| 4 | Independent | 1,427 | 11.1% |
| 5 | Baptist | 1,196 | 9.3% |
| 6 | Australian Christian Churches | 777 | 6.0% |
Anglican's 15.2% directory share materially exceeds its 9.8% Census affiliation share, reflecting the geographic breadth of the 23-diocese parish register. Rural, regional, and remote parishes are documented in full; Independent and Pentecostal networks concentrate in metropolitan and outer-suburban growth corridors.
Active listings in the auschurches.com.au directory as of 3 July 2026. Scope is trinitarian Christian denominations only; Jehovah's Witnesses, Latter-day Saints, and Unitarian congregations are excluded per the editorial policy. Honeypot and duplicate records are filtered.
State-level population from ABS QuickStats 2021 (Estimated Resident Population). Christian affiliation from ABS 2021 Census Snapshot RELP. Metro populations from ABS 2021 GCCSA (Greater Capital City Statistical Area). Held constant until 2026 Census results release (expected 2027).
Quarterly. Each version-stamped URL stays resolvable. Q3 2026 is the current edition; Q4 2026 publishes ~1 October at a distinct URL. Aggregate tables are CC-BY 4.0 licensed; attribute "Australian Church Directory, Q3 2026 report."
Press, licensing, and data enquiries: hello@auschurches.com.au
Next update: Q4 2026 (~1 October 2026) at /guides/church-density-in-australia-2026-q4. Q3 URL stays live for citation resolvability.